 Latchpoint
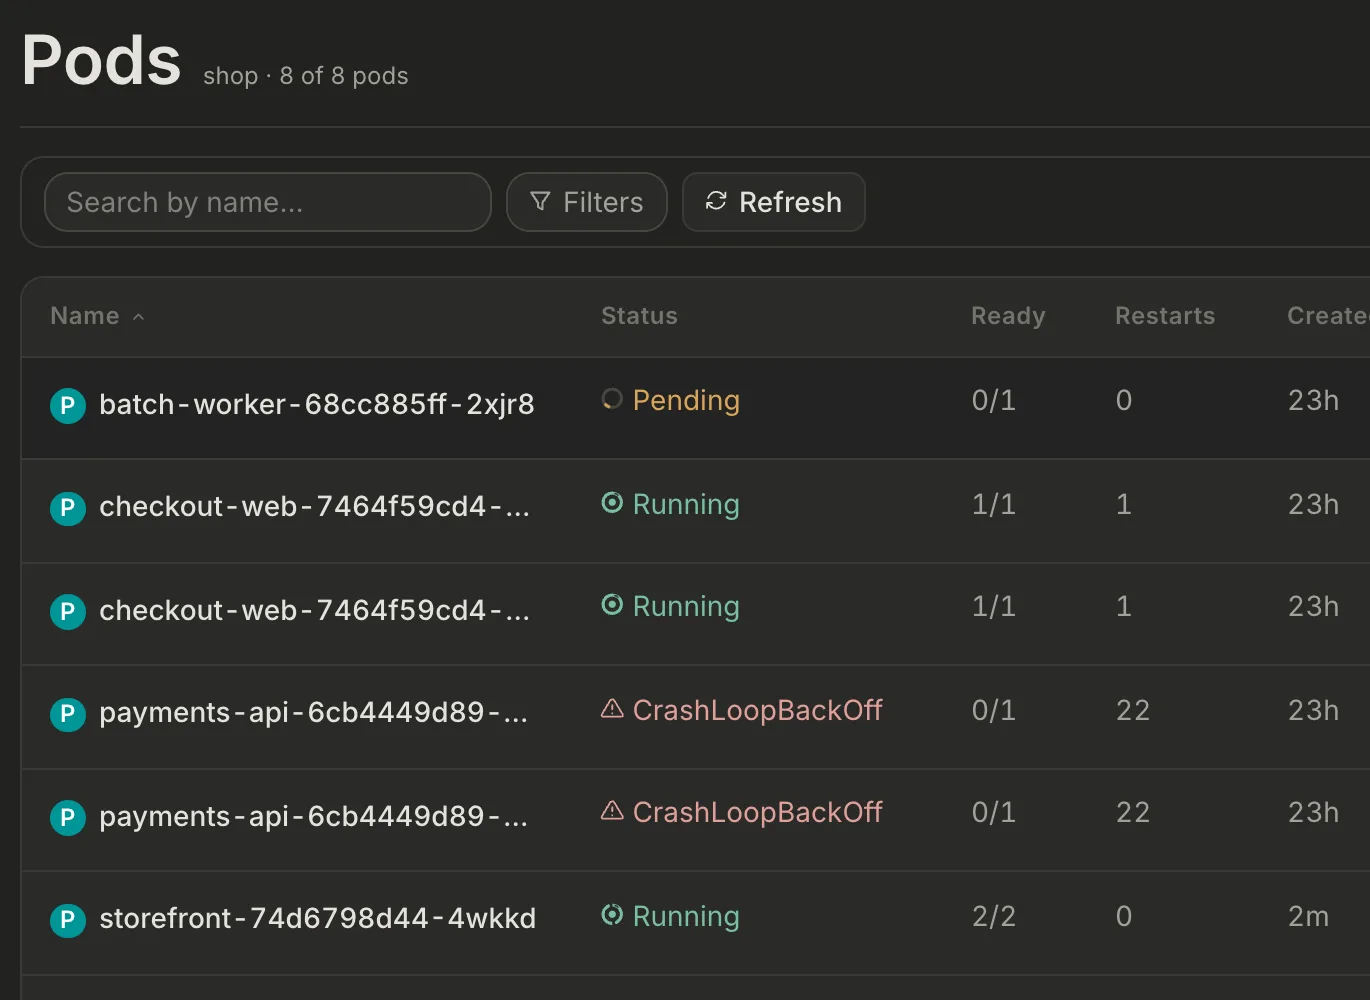
Every pod, as the cluster reports it
Lists read live from the Kubernetes API and refresh on their own. Pending and crash-looping pods stand out without opening each one.
Latchpoint runs against any cluster in your kubeconfig. On GKE and EKS it goes further: it signs your team in, calls the cluster as each person so everyone sees exactly what their RBAC allows, and brings in Cloud Build, Cloud Logging, ECR, CloudWatch and node groups.

Find the hop where traffic stops, read why the pod crashed and roll back the change, all from one console that acts as you.
Topology draws each request's path from left to right: HTTPRoute, Service, workload, pods, and out to the hosts your workloads call outside the cluster. A broken hop turns red right where the traffic stops.
Moving dots mean a Service has ready endpoints and the pods behind it are running.
A route to a missing Service, a Service with no ready pods, or a crash-looping pod.
From ExternalName Services, env vars such as ANALYTICS_URL, and NetworkPolicy egress rules.
Request rates from Istio or Cilium Hubble, when your Prometheus scrapes them.
Lists read live from the Kubernetes API and refresh on their own. Pending and crash-looping pods stand out without opening each one.
Switch to the previous container to read the run that just died. The log summarizer explains the tail and answers follow-up questions.
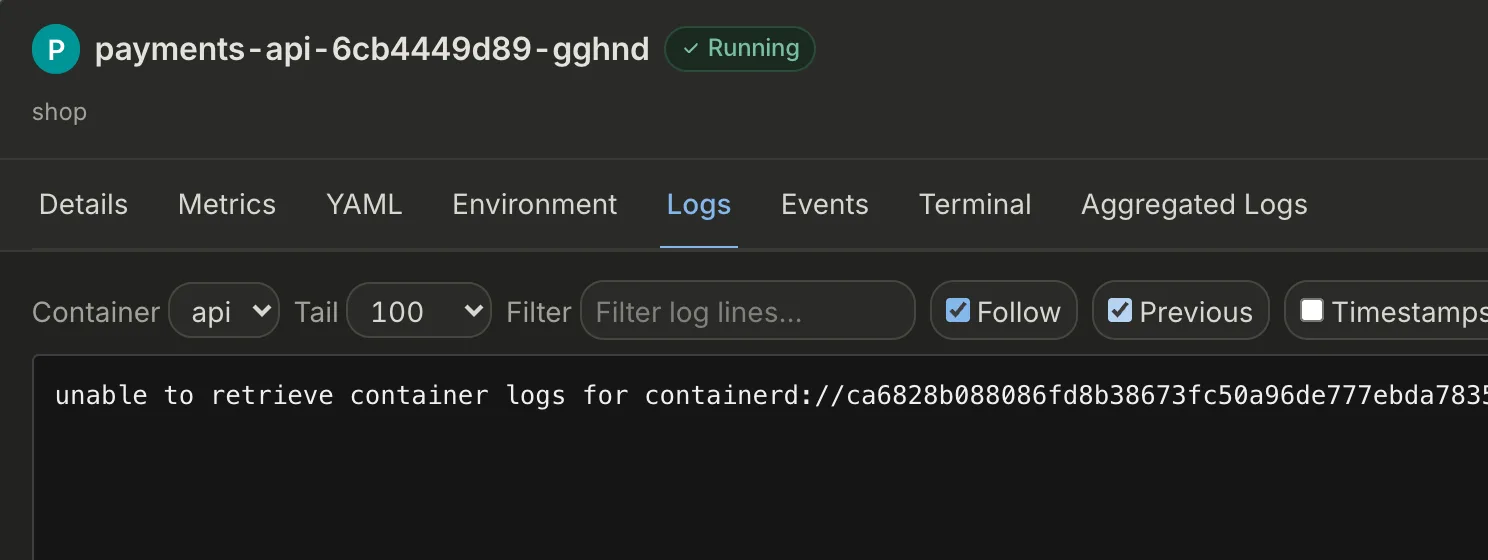
It reads pod status, logs, events and resources as you, so it can't see more than you can.
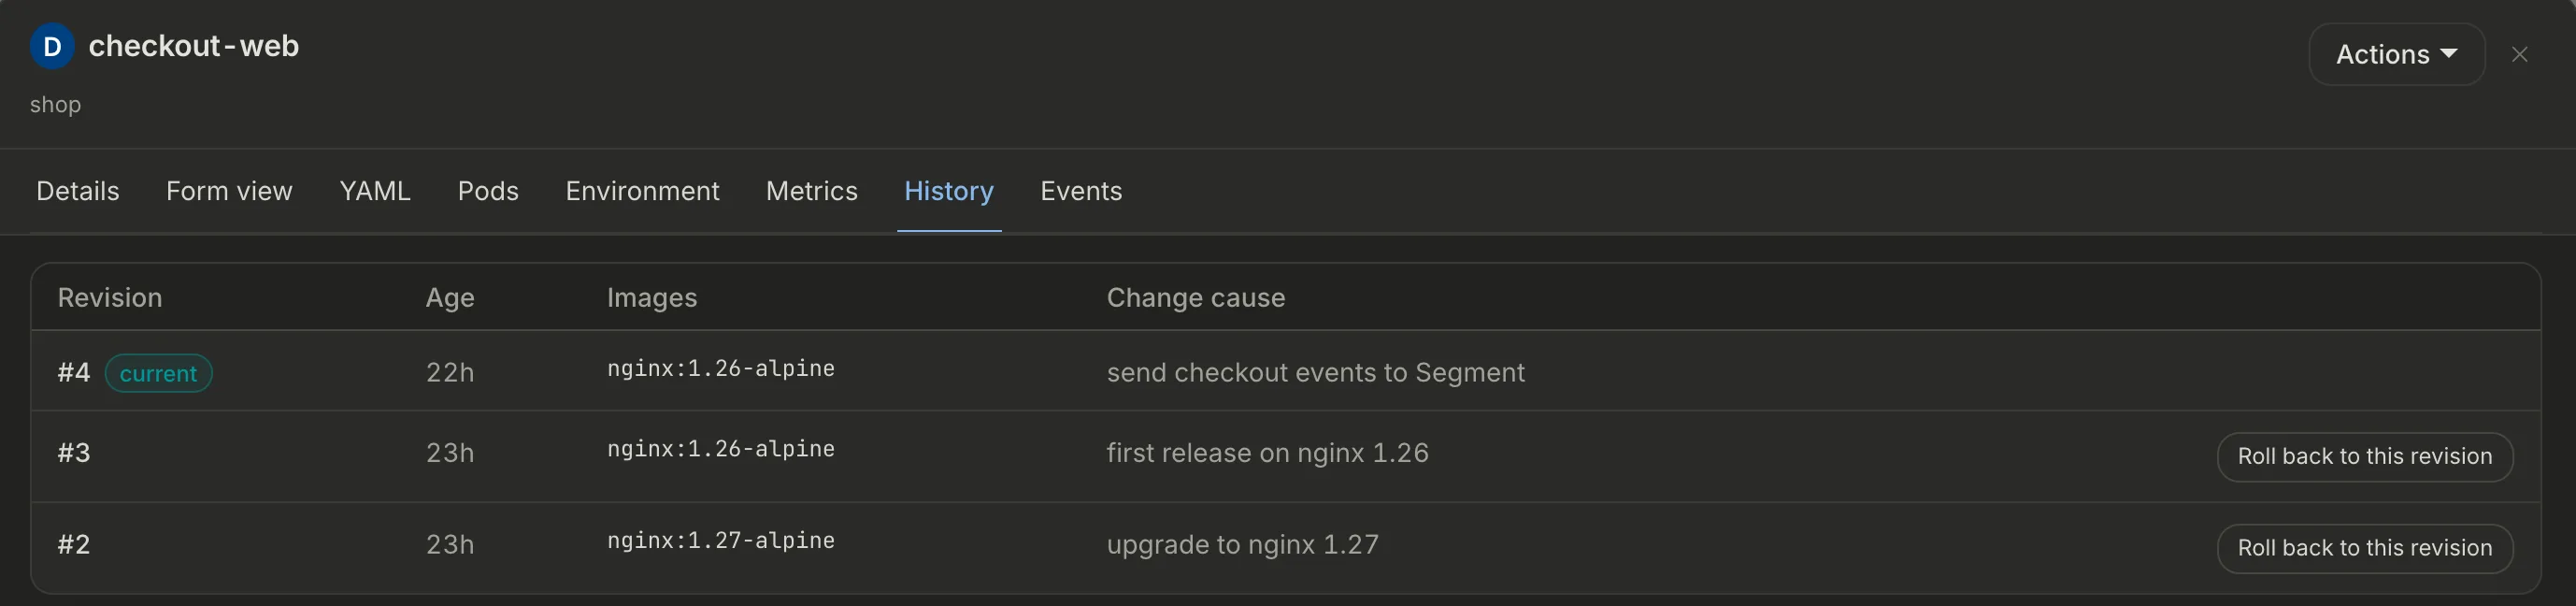
Each Deployment's History tab lists every revision with its images and change cause. Pick one and roll back after a confirmation. Helm releases get the same, with diffs between revisions.
Helm releases with decoded history and rollback, Argo CD Applications and ApplicationSets, and GitHub Actions runs.
Cloud Shell, debug containers, "Why can't I?" permission answers, a network check and incident bundles for tickets.
When Kubernetes says no, "Why can't I?" shows which RoleBindings would allow the action and which of their groups you're in. Then it writes the access request for you to paste into a ticket.
Why can't I delete pods in payments?
You can't delete pods in payments.
Signed in as dev@example.com. The cluster sees your groups as: developers.
RoleBinding payments-oncall in payments, role ClusterRole edit
payments-oncallsre-leads
Managed by argocd.
Please add dev@example.com to the Identity Center group payments-oncall. It is bound by RoleBinding payments-oncall (role edit) and lets me delete pods in payments.
CopyCopiedOne Helm chart and two images, whichever cloud you're on.
Deploy into the cluster you want to manage, or outside it to manage many clusters across projects and accounts.
# helm/values.yaml
cloud: eks   # or gke
Turn on Google, Okta or AWS IAM Identity Center, side by side if you like. On GKE you can put the console behind Identity-Aware Proxy instead.
Each person signs in and sees what their RBAC allows. Developers only see the namespaces they can use. Nobody gets new access.
Latchpoint runs in your cloud and holds no standing access to your workloads. Every request is checked against Kubernetes RBAC as the person who made it, then written to an audit log.
SelfSubjectAccessReview and writes the audit recordGoing through a security review? The deployment guide includes a checklist for regulated and healthcare environments: CMEK encryption at rest, handling sensitive data in logs, and audit retention. We'll walk your team through it.
Talk to us about securityPoint it at any context in your kubeconfig, such as Docker Desktop's. No cloud account or sign-in needed. You see whatever kubectl sees.
This local mode refuses to start outside development, so it can't end up in production by accident.
# backend, on http://localhost:8080
$ cd backend && npm ci
$ NODE_ENV=development AUTH_MODE=none \
    KUBECONFIG_CONTEXT=docker-desktop \
    IN_CLUSTER_LOCATION=local npm run dev

# frontend, on http://localhost:5173
$ cd frontend && npm ci && npm run dev
Every feature is in every plan. Paid plans add help from the people who build Latchpoint.
Free
Self-hosted on your own clusters.
$149$179 per cluster / month
Billed yearly. For teams running Latchpoint in production.
Billed monthly, cancel any time. For teams running Latchpoint in production.
Custom
For 20 or more clusters, or strict compliance needs.
A cluster counts once it's connected to Latchpoint, whatever its size. Every paid plan starts with a 30-day trial.
Anything else, write to sales@latchpoint.cloud.
On your laptop it runs against any cluster in your kubeconfig, including Docker Desktop and kind. A shared deployment, with sign-in and per-person access, runs on GKE and EKS.
No. You run Latchpoint in your own cloud and it has no analytics or telemetry built in. The AI features only call a model endpoint if an admin configures one, and then only the one you choose.
No. Every action runs as the signed-in person and Kubernetes RBAC decides whether it's allowed. The console's own identity can't read your application Secrets.
Any cluster connected to Latchpoint, whatever its size or node count. Autoscaling doesn't change your bill.
Choose Team or Enterprise to keep the support, or stay on Community. The console keeps working either way, because every feature is in every plan.
Google, Okta and AWS IAM Identity Center, which can run side by side. On GKE you can also put the console behind Identity-Aware Proxy.
Start a 30-day Team trial on your own GKE or EKS clusters. Tell us how many clusters you run and we'll set it up with you.